



Key Highlights:
- Economic order quantity (EOQ) sets the order size where yearly ordering and holding costs balance, and it can cut an SKU’s combined cost by around 21% in the worked example, even though holding cost doubles.
- Calculate EOQ for each SKU at each stock location, using demand pooled from every channel that location serves.
- The result is forgiving: ordering 20% above or below EOQ adds less than 3% to annual cost, so rounding to a pack size is safe.
- Campaign peaks, volume discounts, and shelf life each need a specific adjustment to the inputs or a cap on the result.
- EOQ sets how much to order, not when, so pair every EOQ with a reorder point and safety stock.
Every time you reorder, you choose between paying more to place orders and paying more to hold stock. Frequent small orders mean paying to raise and receive a purchase order again and again, while infrequent large ones tie up cash and warehouse space in stock that has not sold.
The balance is harder to strike when one pool of inventory serves a webstore and several marketplaces. These multichannel inventory challenges make reorder quantities carried over from last season harder to defend.
Teams that calculate economic order quantity (EOQ) from reliable demand and cost data, then adjust it for supplier minimums and shared warehouse space, can back every reorder with numbers they can explain to finance. This blog works through the EOQ formula with an example and shows where the economic order quantity model needs adjusting for e-commerce.
What Is Economic Order Quantity (EOQ)?
Economic order quantity (EOQ) is the number of units to order each time you restock an item so that the combined annual cost of ordering and holding it is as low as possible. Inventory teams calculate it for one stock-keeping unit (SKU) at a time, using that item’s own demand and cost figures.
As order size grows, the two costs move in opposite directions.
Ordering cost falls: The same yearly demand is covered by fewer orders.
Holding cost rises: Average stock on hand is roughly half of each order, and every unit held carries a storage and financing cost.
In the basic model, EOQ sits where these two annual costs are equal, which is also where their combined total is lowest.
The EOQ Formula
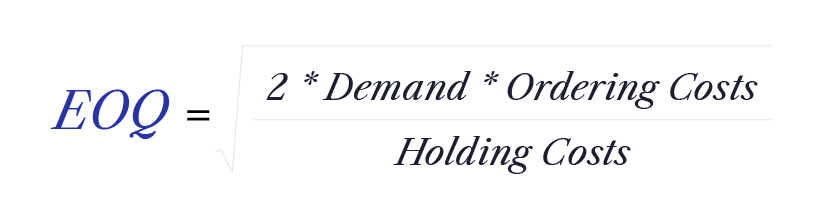
The EOQ formula takes the square root of twice the annual demand multiplied by the cost per order, divided by the annual cost of holding one unit. All three inputs must cover the same period, usually one year, or the result will be off.
EOQ = √2DS ÷ H
- D is the annual demand in units for the SKU at the stock location you are replenishing.
- S is the fixed cost of placing and receiving one order.
- H is the cost of holding one unit in stock for a year.
What to include in ordering and holding costs
Ordering cost covers only the costs that occur once per order, whatever its size. Holding cost covers the costs that grow with every unit kept in stock. Mixing the two, or including costs that belong to neither, distorts the result before the formula even runs.
| Input | Include | Leave out |
| Ordering cost (S) | Staff time to raise and approve the purchase order, freight or delivery charges billed per shipment, and labour to receive and inspect each delivery. | The unit purchase price and freight charged per unit, since both scale with quantity rather than with how often you order. |
| Holding cost (H) | Storage cost per unit per year, insurance, shrinkage, and the cost of capital tied up in each unit. | Fixed warehouse costs, such as rent you pay regardless of your stock level. |
Table 1: What to include in ordering cost (S) and holding cost (H), and what to leave out
If your finance team expresses holding cost as an annual percentage of item value, multiply that rate by the unit cost to get H.
Worked example: how to calculate economic order quantity for one SKU
A retailer selling one wireless-earbud model from a single warehouse would order about 949 units at a time using the figures below.
- Annual demand (D) is 12,000 units.
- Ordering cost (S) is US$ 150 per order.
- Holding cost (H) is US$ 4 per unit per year.
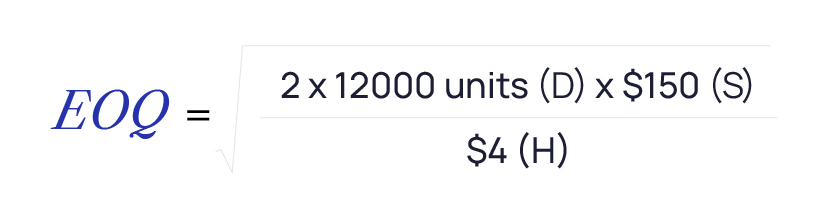
EOQ = √2×12,000×150 ÷ 4 = √900,000 = 949 unita
At 949 units per order, the retailer places about 12.6 orders a year, or roughly one every 29 days. The table compares that with its current habit of ordering about 462 units every two weeks.
| Current: 26 orders a year | EOQ: 12.6 orders a year 949 US$ 1,897 474.5 units US$ 1,898 US$ 3,795 | |
| Units per order | 462 | 949 |
| Annual ordering cost | US$ 3,900 | US$ 1,897 |
| Average stock on hand | 231 units | 474.5 units |
| Annual holding cost | US$ 924 | US$ 1,898 |
| Total annual cost | US$ 4,824 | US$ 3,795 |
Table 2: Annual ordering and holding costs for the earbud SKU at its current order size versus EOQ
Switching to EOQ cuts this SKU’s combined ordering and holding cost by about US$ 1,029 a year, or 21%. Holding cost doubles, but ordering cost falls by more. At EOQ, the two costs are almost exactly equal, which is a quick way to check your own calculation.
How sensitive is EOQ to errors in your inputs?
Total cost changes very little near EOQ, so rounding the result or working from imperfect estimates costs less than you might expect.
- Ordering off EOQ: In the earbud example, ordering 20% more (1,138 units) raises total annual cost by 1.7%, and ordering 20% less (759 units) raises it by 2.5%.
- Overestimating demand: If the retailer assumed 24,000 units a year instead of 12,000, its EOQ would rise to 1,342 units, yet its actual annual cost would climb by only about 6% because the formula uses a square root.
- Rounding to pack sizes: You can round EOQ to the nearest case pack or pallet quantity without losing much. Leaning slightly above EOQ costs less than leaning the same amount below it, except for perishable or fast-ageing stock that risks going unsold.
Benefits of Using EOQ in Inventory Management
EOQ gives every reorder a cost-based reference point, which lowers total inventory cost and makes purchasing easier to plan. Getting order size wrong is expensive in both directions. IHL Group’s 2026 Inventory Distortion Study puts the global cost of out-of-stocks and overstocks at US$ 1.7 trillion, or 6.2% of retail sales, across more than 4,500 enterprise retailers. [1]
1. Lower combined ordering and holding costs
EOQ lowers total inventory cost by matching each item’s batch size to its own cost structure. The largest savings sit with SKUs ordered well away from their EOQ. Two patterns show where to look first.
- Ordered too often: Items with a high fixed cost per order, such as cross-border shipments that each carry customs and freight charges, lose the most when bought in small batches.
- Ordered too much: High-value or bulky items carry a high holding cost per unit, so batches sized by habit or supplier convenience can run well above their EOQ.
2. Fewer purchase orders to raise and receive
EOQ usually means ordering less often for fast-moving items, which cuts the purchasing and receiving work tied to each SKU. In the earbud example, EOQ reduces purchase orders from 26 to about 13 a year, halving the approvals, deliveries, and invoice checks for that item. The effect runs the other way for slow, expensive items, where EOQ can call for smaller and more frequent orders to free up cash.
3. Predictable storage and cash requirements
A fixed order size and cycle show how much space and cash each SKU needs before the order is placed. Peak stock for an item is roughly its EOQ plus safety stock, so warehouse teams can reserve space against real figures. Finance can also forecast purchasing outflows, since each order’s value is the EOQ multiplied by the unit cost and repeats on a known cycle.
4. Fewer replenishment cycles exposed to stockouts
EOQ lowers stockout risk indirectly by changing how many times a year stock runs low. A stockout can only occur in the window between placing an order and receiving it, so an item replenished 13 times a year faces that exposure half as often as one replenished 26 times. Whether stock covers demand inside each window still depends on the reorder point and safety stock.
The 6 Assumptions of the EOQ Model
The basic economic order quantity model assumes demand and costs stay fixed for the planning period and that suppliers deliver on time and in full. These simplifications keep the formula solvable by hand, and the closer your operation runs to them, the more you can rely on the result.
| Assumption Demand is known and constant Lead time is known and constant Each order arrives in full Stockouts never happen Ordering and holding costs are fixed The unit price never changes | What the model takes as given |
| Demand is known and constant | Annual demand is spread evenly across the year, with no peaks or dips. |
| Lead time is known and constant | Every order takes the same time to arrive. Lead time only affects when you order, so it does not appear in the formula. |
| Each order arrives in full | The whole batch lands at once, with no partial or staggered deliveries. |
| Stockouts never happen | Stock is always available, so the model carries no cost for lost sales or backorders. |
| Ordering and holding costs are fixed | The cost per order and the cost of holding each unit stay the same all year. |
| The unit price never changes | Each unit costs the same at any order size, so volume discounts are ignored. |
Table 3: The six assumptions behind the basic EOQ model
Few of these assumptions hold all year for multichannel sellers, so treat them as a checklist for your inputs. A central inventory view across channels and warehouses keeps those inputs current for each SKU.
Limitations of EOQ in Real E-commerce Operations
E-commerce operations break several EOQ assumptions at once, but each break has a specific fix, applied either to the inputs before you calculate or to the result afterwards. Treating EOQ as a starting quantity and adjusting it the right way keeps the cost logic intact while reflecting how your stock actually moves.
1. Demand that spikes around campaigns
An annual demand figure averages out peaks such as 11.11 and payday sales, so a single EOQ orders too little during the peak and too much after it. Calculating two EOQs keeps order sizes in step with how fast stock is moving.
- Peak EOQ: Use the campaign period’s demand rate, scaled to a yearly figure, for orders placed ahead of and during the campaign.
- Regular EOQ: Switch back as soon as the campaign ends, since carrying the peak quantity into a quiet month builds excess stock.
2. Stock shared across channels and warehouses
Annual demand (D) should be the combined demand drawing on the stock location being replenished, not the sales of a single channel.
One warehouse serving several channels: Add up demand from every channel it fulfils, such as your webstore and two marketplaces, and calculate one EOQ.
Separate warehouses per region or channel: Calculate a separate EOQ for each location, since each has its own demand and often its own ordering and holding costs.
3. Lead time and costs that shift with trade conditions
Longer or less predictable lead time changes when you should order rather than how much, so the reorder point and safety stock absorb most of that adjustment.
Trade conditions can also move the costs inside the formula. Kearney’s key takeaways from the 2026 State of Logistics report, which tracks US logistics for the Council of Supply Chain Management Professionals (CSCMP), note that trade policy changed on average every 1.5 weeks in 2025. [2] Recalculate EOQ whenever either cost input moves.
- Ordering cost (S): Update it when per-shipment freight or customs clearance fees change.
- Holding cost (H): Update it when duties increase or decrease the unit cost, since holding cost usually scales with item value.
4. Volume discounts that make a larger order cheaper
A supplier’s lower unit price above a set quantity can bring total cost below what you would pay at EOQ. Three steps show whether the discount lowers your total cost.
- Calculate the total annual cost at EOQ, including the purchase cost of the units.
- Calculate the same total at each discount threshold above EOQ, using the discounted unit price.
- Order the quantity with the lowest total.
Where holding cost is set as a percentage of item value, recalculate holding cost (H) at each threshold using the discounted price, since a cheaper unit also costs less to hold.
5. Products with a shelf life or short season
EOQ carries no cost for stock that expires or goes out of fashion, so it can recommend more units than you can sell in time. Cap each order at the quantity you expect to sell before the expiry date or the end of the season, minus stock already on hand or on order, and order the lower of that cap and EOQ.
Rotating stock with first in, first out (FIFO) then sells older units before newer ones. Rotation reduces waste within the cap but cannot rescue a purchase larger than the remaining selling window.
6. Space and budget limits across many SKUs
EOQ optimises one SKU at a time, so the EOQs across a whole catalogue can add up to more warehouse space or purchasing budget than you have. Two adjustments bring the total back within limits.
- Trim orders evenly: Because total cost rises slowly away from EOQ, reducing every SKU’s order by a similar percentage usually costs less than cutting a few SKUs sharply.
- Combine orders from the same supplier: SKUs that share one shipment split its fixed costs, which lowers the ordering cost (S) for each item.
Economic Order Quantity vs. Reorder Point
EOQ sets how much to order, and the reorder point sets when to place that order, so a complete replenishment policy needs both. In the earbud example, the retailer orders 949 units each time stock falls to 662.
| Economic order quantity (EOQ) | Reorder point | |
| Question it answers | How much to order | When to order |
| Calculation | √((2 × annual demand × ordering cost) ÷ holding cost) | Daily demand × lead time + safety stock |
| Earbud example | √((2 × 12,000 × 150) ÷ 4) ≈ 949 units | 33 units a day × 14 days + 200 units ≈ 662 units |
| Recalculate when | Demand, ordering cost, or holding cost changes | Demand rate, lead time or supply reliability changes |
Table 4: How EOQ and the reorder point split the replenishment decision, using the earbud SKU example
The two settings move independently, so a cheaper freight contract lowers EOQ without changing when you order.
Economic Order Quantity vs. Minimum Order Quantity (MOQ)
EOQ is the order size that costs you least, while a minimum order quantity (MOQ) is the smallest order a supplier will accept. The two only conflict when the MOQ sits above your EOQ.
| Economic order quantity (EOQ) | Minimum order quantity (MOQ) | |
| Who sets it | You, from your own demand and costs | The supplier, from its production or shipping costs |
| What it protects | Your combined ordering and holding cost | The supplier’s margin on each order |
| How it changes | Recalculated whenever your inputs change | Fixed until you renegotiate |
Table 5: How EOQ and MOQ differ in who sets them and what they protect
An MOQ below EOQ needs no action, since you simply order the EOQ. An MOQ above EOQ costs less than it seems when the gap is small. In the earbud example, an MOQ 20% above EOQ adds about 1.7% to annual cost, while an MOQ of twice the EOQ adds about 25%. At gaps that size, two moves can bring the cost back down.
- Negotiate the minimum: Show the supplier your EOQ and annual volume to support a lower MOQ or a price break that offsets the extra holding cost.
- Meet it across SKUs: Ask whether the MOQ can be met with a mix of SKUs, so several items share one order instead of each being overbought.
Implementing EOQ in Your Business
Rolling EOQ out on a small group of SKUs first shows which inputs need fixing before you apply it across the catalogue. A pilot also gives purchasing and finance teams one agreed set of figures before any order sizes change.
1. Choose a pilot group
High-volume SKUs that sell all year steadily and come from reliable suppliers make the best starting point, since their inputs are the easiest to check. Once the method is settled, you can add campaign-driven, perishable, and MOQ-bound items.
2. Pull demand by stock location
The demand figure should cover the last 12 months of sales for each SKU at the location you replenish, taken from your retail inventory management records. Out-of-stock weeks need adjusting upwards, because recorded sales understate real demand while an item is unavailable.
3. Align cost inputs with finance
Ordering cost should cover only the fixed costs of placing and receiving each order, and holding cost only the costs that grow with every unit stored, such as warehouse space and the capital tied up in stock. Finance can confirm both figures for each SKU or product category. Noting where each figure came from keeps the next recalculation on the same basis.
4. Calculate and adjust
Run the EOQ formula, round the result to the nearest pack or pallet size, then check it against supplier terms and shelf life.
5. Set the reorder point alongside
Pair each EOQ with a reorder point and safety stock based on that SKU’s lead time, so replenishment covers when to order as well as how much.
6. Review results and recalculate
Two or three order cycles give enough data to compare the pilot SKUs’ combined ordering and holding cost and their inventory turnover ratio with the previous period. If the results hold up, extend EOQ to the next group of SKUs and recalculate whenever demand or cost inputs shift.
How Inventory Management Systems Enhance EOQ Implementation
An inventory system supplies four of the figures EOQ and the reorder point depend on, and this data is kept current across every channel and location:
- Demand by stock location: An enterprise order management system that pulls orders from every sales channel into one place gives you pooled demand per SKU, plus the daily sales average the reorder point needs.
- Stock already on hand: A central view across warehouses, dark stores, and retail stores, with low-stock and out-of-stock flags, shows what each location holds before you reorder.
- Campaign demand: Promotional sales reports show what each campaign sold, which helps you set a peak EOQ apart from the regular one.
- Stock reserved for campaigns: Reserving inventory ahead of mega sales days keeps campaign orders from drawing down regular stock.
Note: ordering and holding costs still come from purchasing and finance records, so agree on them with finance before each recalculation.
Put EOQ to Work on Your Next Purchase Order
EOQ gives each SKU an order size you can defend, but only while its inputs hold. A campaign, a new freight contract or a shift in channel mix can move them within weeks, so check the result against current figures rather than last year’s.
Your next purchase order is the simplest place to begin. Before you send it, compare the quantity with that SKU’s EOQ, and use any gap to question the habit behind the order size.
Keeping the inputs current is easier when orders and stock sit in one system. Anchanto’s Order Management System pulls orders from 70+ sales channels into one place and allocates inventory across them in real time. That gives you pooled demand for each SKU, while promotion reports keep campaign peaks apart from regular sales. Anchanto’s Warehouse Management System tracks stock at every location in real time and manages batch and expiry dates for shelf-life products. It also maps racks, shelves, and bins, so you can see whether an order fits the space and the selling window before it arrives.
Talk to our team to learn more about how our solutions can help you manage efficient and cost-effective stock replenishment and more.
FAQ
1. How does economic order quantity help reduce inventory costs?
EOQ lowers inventory costs by identifying the order size at which an item’s combined annual ordering and holding cost is lowest. The total falls even when one of the two costs rises, and SKUs currently ordered far from their EOQ have the most to gain.
2. What are the most common economic order quantity problems businesses face?
Economic order quantity results go wrong when the inputs are inaccurate, such as demand figures that miss stockout periods or ordering costs that wrongly include unit prices. A sound result can also clash with supplier minimums, shelf life, or warehouse space, which the basic model does not consider.
3. Can the economic order quantity formula be modified for seasonal products?
Seasonal products can use EOQ by calculating a separate order quantity for each demand period, such as peak and regular months, with each period’s demand scaled to a yearly rate. Orders should also be capped at what can sell before the season ends.
4. How often should I recalculate my EOQ?
Recalculating EOQ whenever demand or cost inputs change noticeably, such as after a campaign or a new freight contract, keeps order sizes current. A fixed review cycle, for example, once a quarter, also catches gradual drift between those changes.
5. Which industries benefit the most from EOQ?
EOQ suits businesses with steady demand and repeat replenishment, such as wholesale distribution and spare parts, where ordering and holding costs are easy to estimate. Fashion and fresh food need the result capped or adjusted, because unsold stock in those categories loses value quickly.
6. Does EOQ work for omnichannel retailers?
Omnichannel retailers can use EOQ by calculating it for each stock location, pooling demand from every channel that draws on that location’s inventory. A single business-wide EOQ gives impractical order sizes, because it ignores where stock actually sits and what each location costs to replenish.