
Why Are Business Leaders and Ops Teams Arguing About Different Omnichannel Problems?
Blogs
Key Highlights
- Leaders see the strain; the disagreement is over what it means. The C-suite ranks omnichannel highest (83% first or top-three, against 74% overall) and also reports the most manual effort (65%, against 55%).
- Directors are the earliest warning signal. They turn strategy into working systems, and 48% name integration complexity as the biggest barrier to scaling, against 38% overall.
- High satisfaction can hide low maturity. 86% are satisfied with their omnichannel performance, yet only 12% are optimised and only 6% have end-to-end visibility.
- Closing the gap starts with a shared baseline. The report’s 10-step Omnichannel Execution Maturity Model begins by benchmarking perceived maturity against operational reality.
Ask a CEO how omnichannel is going, and you will likely hear that it is going well. Ask the director actually running it, and you may hear a different story regarding the challenges they face on a daily basis. These two perspectives are the result of each expert looking at different evidence.
Anchanto and Demand Metric’s The State of Omnichannel Commerce 2026/27 surveyed 408 commerce decision-makers across every level, from C-suite leaders to managers, and found that seniority changes not just how confident someone feels about their omnichannel operating model, but which problems they see in the first place. The C-suite tends to focus on priority and performance. The people actually managing omnichannel day to day tend to focus on what keeps breaking underneath it. Both views are accurate. Neither one is complete on its own.
1. What the C-Suite Sees
The C-suite gives omnichannel the strongest priority signal in the report. 83% rank omnichannel as a first or top-three priority, the highest of any seniority level, against 74% overall.
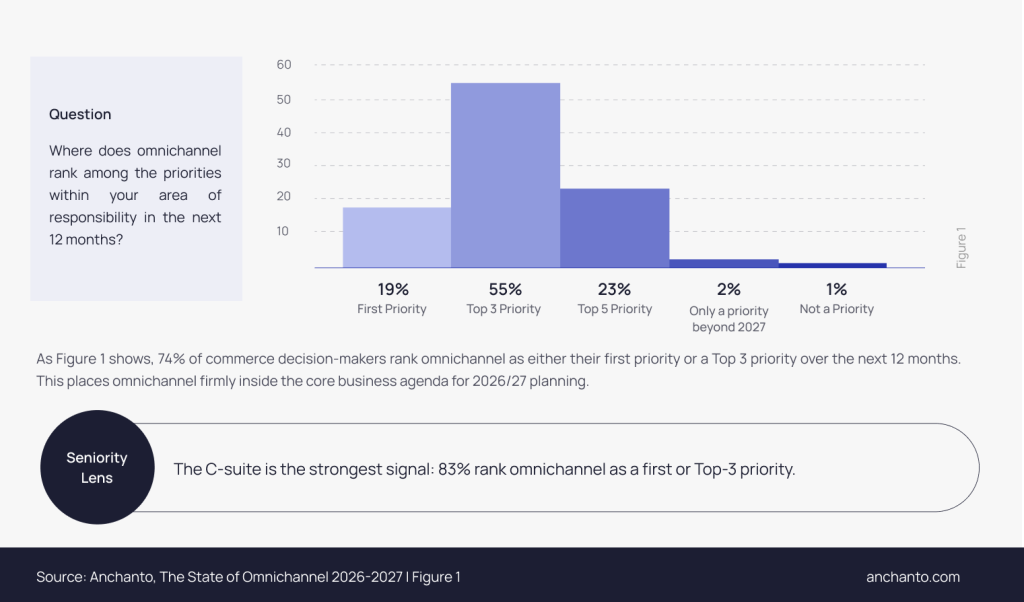
Figure 1: Where omnichannel ranks among priorities for the next 12 months. 74% of commerce decision-makers rank omnichannel as their first priority (19%) or a top-three priority (55%) for the next 12 months. A further 23% rank it top five, 2% only beyond 2027 and 1% not at all. Among the C-suite, 83% rank it first or top three. Source: Anchanto and Demand Metric, The State of Omnichannel Commerce 2026/27, survey of 408 commerce decision-makers.
That same group also reports the biggest share of high or very high manual effort of any seniority level in the survey: 65%, against 55% overall. So, leadership is not blind to the manual strain underneath their own strategy. They may simply read it as a resourcing issue or a growing pain rather than a sign that the systems underneath have not kept pace with how much the business has scaled. From where they sit, a strategy that is hitting its numbers looks like a working strategy, even when the team executing it is quietly patching the gaps by hand every day.
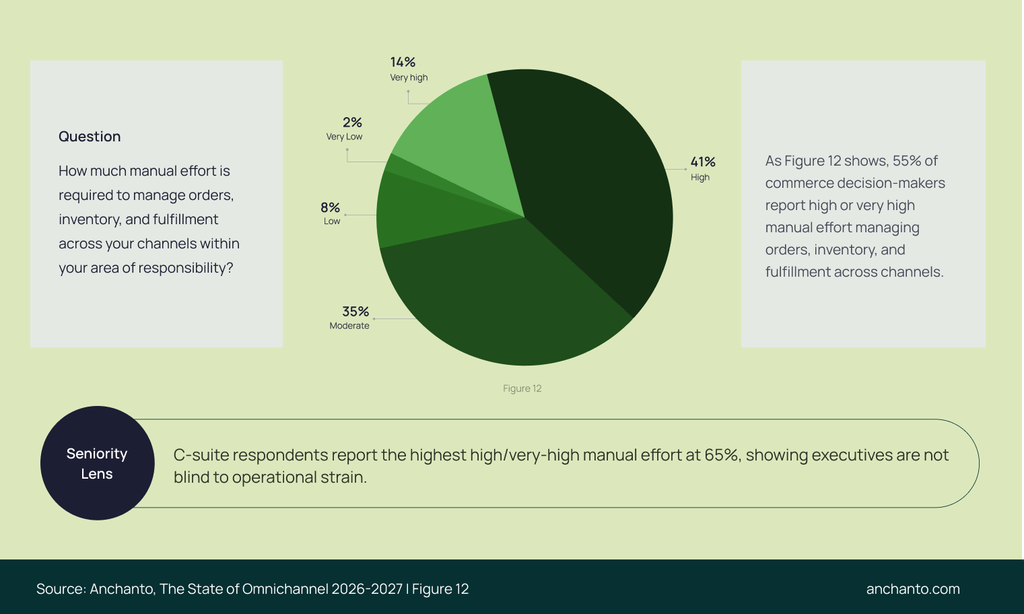
Figure 12: Manual effort required to manage orders, inventory and fulfilment. 55% of commerce decision-makers report high (41%) or very high (14%) manual effort managing orders, inventory and fulfilment across channels; 35% report moderate, 8% low and 2% very low effort. C-suite respondents report the highest share of high or very high manual effort, at 65%. Source: Anchanto Demand Metric, The State of Omnichannel Commerce 2026/27, survey of 408 commerce decision-makers.
2. What the People Managing Omnichannel See
When we move to the operations level of the organisation, the picture changes. Directors report the strongest integration pain of any seniority group: 48% name integration complexity as the biggest barrier to scaling their technology stack, against 38% of all respondents to that question. The reason is structural. A strategy gets approved at the top in the abstract, as goals, budgets, and priorities. Someone still has to turn that into a working system, connecting catalogue, pricing, inventory, and fulfilment across channels that were never built to talk to each other. Directors sit at exactly that seam, so they are the first to feel it break.
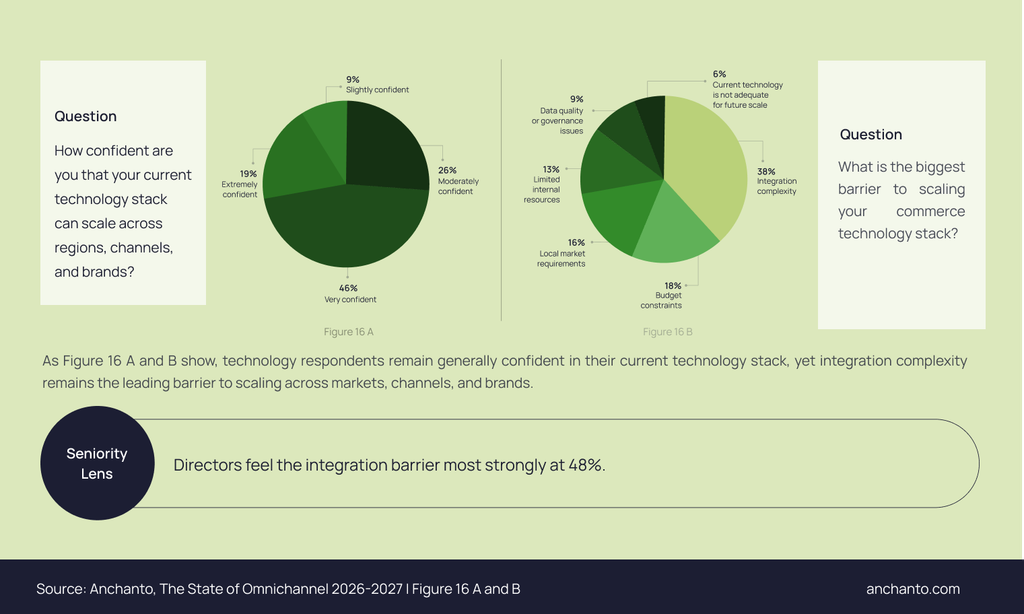
Figure 16A and 16B: Technology stack confidence and the biggest barrier to scaling it. 65% of technology respondents are very (46%) or extremely (19%) confident their technology stack can scale across regions, channels and brands; 26% are moderately and 9% slightly confident. Yet integration complexity is the biggest barrier to scaling (38%), ahead of budget constraints (18%), local market requirements (16%), limited internal resources (13%), data quality or governance (9%) and inadequate current technology (6%). Directors feel the integration barrier most strongly, at 48%. Source: Anchanto, The State of Omnichannel Commerce 2026/27, survey of 408 commerce decision-makers.
Managers, one level further into execution, see something different again. Their focus tends to sit less on transformation and more on making today’s process cheaper and more reliable. They are not thinking about the next strategic bet. They are thinking about the reconciliation that has to happen before five o’clock.
Three groups, three different jobs, three different versions of what “the omnichannel problem” actually is.
3. Whose View of Omnichannel Should Take Priority?
None of these views are wrong. That is what makes this hard to fix by simply telling one group to listen to the other. The C-suite’s confidence and the operating team’s strain are both accurate readings of the same organisation, taken from different vantage points.
This is part of why our report closes with a structured framework instead of a single fix. Closing the execution gap is not one decision, it is a sequence, and each step exists to bring leadership’s view and the operating team’s view back onto the same page.
The steps start with defining what the strategy is actually trying to achieve, moving through mapping the systems and handoffs involved and building the connected execution layer, and ending with coordinating expansion so growth only moves as fast as execution can support it. The report lays this out as a 10-step Omnichannel Execution Maturity Model, built specifically so that a leadership team and an operating team can look at the same roadmap and see their own role in it.
Our report, The State of Omnichannel Commerce 2026/27, breaks down these findings by seniority, region, industry, and company size, along with the full maturity model for closing the omnichannel execution gap between what leadership sees and what the operating team lives with every day.
Download the full report here!FAQs
1. What is an omnichannel operating model?
It is the way an organisation coordinates channels, systems, inventory, fulfilment networks, local requirements and customer data behind every sale. The State of Omnichannel Commerce 2026/27 describes the next phase of omnichannel as connected execution: running all of this through one commerce operating model rather than channel by channel.
2. Why do executives and operations teams see omnichannel differently?
They look at different evidence. The C-suite sees priority and performance, and 83% rank omnichannel a first or top-three priority. Directors sit where strategy becomes systems and feel the integration barrier most (48%), while the people running omnichannel day to day see what keeps breaking underneath it.
3. How can you optimise omnichannel retail operations across leadership and ops teams?
Put both views on one roadmap. Define what the strategy is meant to achieve, benchmark perceived maturity against operational reality, map the systems and handoffs involved, then build the connected execution layer, so leadership’s confidence and the operating team’s daily experience describe the same reality.
4. What is the Omnichannel Execution Maturity Model?
A 10-step roadmap in The State of Omnichannel Commerce 2026/27 for closing the gap between omnichannel confidence and connected execution. It runs from defining the omnichannel ambition and benchmarking perceived maturity against reality, through mapping the commerce operating layer, to coordinating expansion with execution readiness.
About the data.
The State of Omnichannel Commerce 2026/27 is based on a global survey of 408 qualified commerce decision-makers (395 complete and 13 partial responses) at organisations with annual revenue above US$ 100 million, run by Anchanto with Demand Metric. Respondents are directly involved in commerce strategy, technology or operations, and are split across the Americas (27%), Europe (27%), APAC (25%) and the Middle East and Africa (21%).