
Why Global Omnichannel Strategies Fail Without Local Execution
Blogs
Key Highlights
- No function owns omnichannel on its own. In our study, IT and sales are each named by 49% as sharing ownership of strategy and budget, and six other functions are named alongside them, from e-commerce and operations (44% each) to procurement (18%).
- Regulation tops the list of local friction. Regulatory and compliance requirements are named by 39%, with inventory and fulfilment processes and marketplace requirements one point behind at 38% each.
- The biggest local problem depends on where you sell. Europe leads on regulatory friction (44%), APAC on marketplace requirements (49%), and the Americas on carriers and delivery partners (41%).
- Hybrid is the most common model, but not the majority. Central control with local flexibility leads at 36%, yet more than half of organisations still run fully or mostly centralised operations.
Two things decide whether an omnichannel strategy survives contact with a market: whether the strategy actually accounted for what the market requires, and whether anyone is clearly responsible for adjusting it when it falls short.
Regulatory and compliance requirements are the biggest source of local market friction overall, according to Anchanto and Demand Metric’s report, The State of Omnichannel Commerce 2026/27, a survey of 408 commerce decision-makers at companies with annual revenue above US$ 100 million. And ownership of the strategy itself is spread across several teams, which makes it harder to say who decides when a market needs something different.
Out of the two challenges, let’s first look at ownership, because that is usually where the first crack appears.
1. No Single Function Owns Omnichannel
We asked 408 commerce decision-makers across the Americas, Europe, MEA, and APAC which functions own the omnichannel strategy and budget inside their organisation. The answer was several teams, all at once.
IT or technology and sales were each named by 49% of respondents as sharing ownership of their omnichannel strategy and budget. E-commerce and operations followed at 44% each, with marketing at 38%.
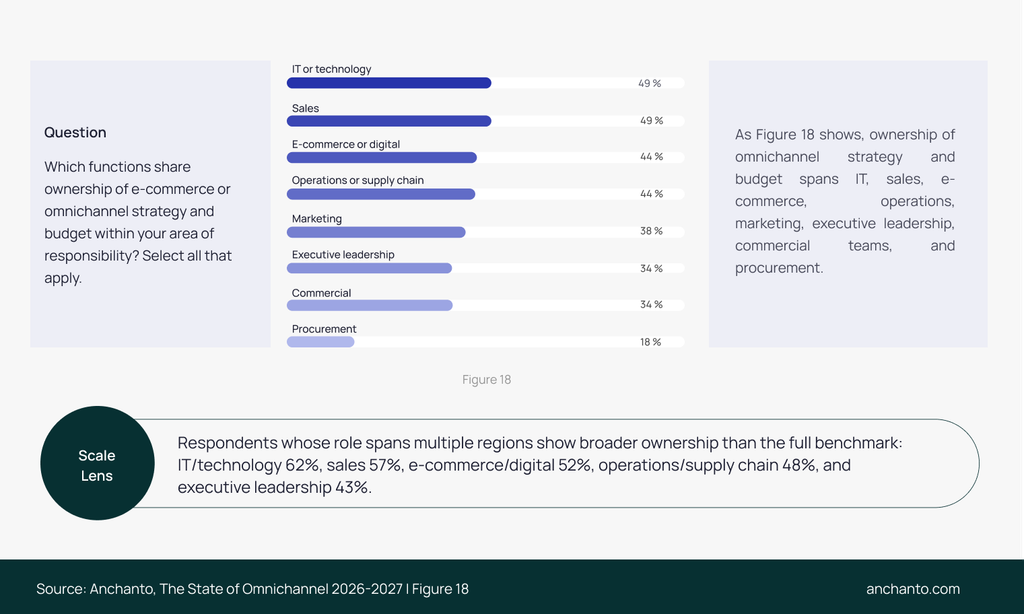
Figure 18: Functions that share ownership of omnichannel strategy and budget. Ownership of omnichannel strategy and budget is spread across functions: IT or technology (49%), sales (49%), e-commerce or digital (44%), operations or supply chain (44%), marketing (38%), executive leadership (34%), commercial (34%) and procurement (18%). Respondents could select all that apply. Source: Anchanto and Demand Metric, The State of Omnichannel Commerce 2026/27, survey of 408 commerce decision-makers.
That kind of spread sounds like collaboration, but in practice, it often means the opposite. A market-specific decision, adjusting a promotion, approving a new fulfilment partner, responding to a local competitor- has to pass through several teams before anyone can act on it. By the time ownership is sorted out, the competition has already moved in, the promotion period has expired, or the customer has moved on.
Our report also shows how this ownership spreads even wider among leaders whose roles cover multiple regions.
2. Local Markets Don’t Play by Global Rules
Even with clear ownership, an omnichannel strategy still has to work in a local market. We asked where local market complexity creates the most friction. Local regulatory and compliance requirements are the most common source of local market friction, named by 39% of respondents. Local inventory and fulfilment processes (38%) and marketplace requirements (38%) follow close behind.
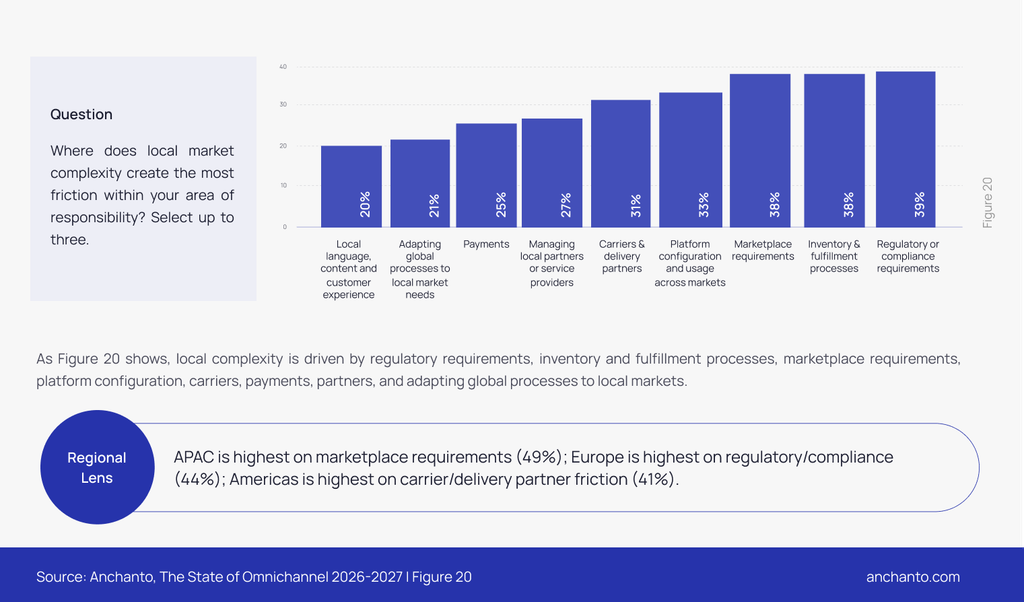
Figure 20: Where local market complexity creates the most friction. Regulatory or compliance requirements create the most local market friction (39%), followed by inventory and fulfilment processes (38%), marketplace requirements (38%), platform configuration across markets (33%), carriers and delivery partners (31%), local partners or service providers (27%), payments (25%), adapting global processes (21%) and local language and content (20%). Europe is highest on regulatory and compliance friction (44%), APAC on marketplace requirements (49%) and the Americas on carriers (41%). Source: Anchanto and Demand Metric, The State of Omnichannel Commerce 2026/27, survey of 408 commerce decision-makers.
Look at it this way: a marketplace that a brand already sells on in one region can have completely different listing, tax, or fulfilment rules in another region. These are the kind of details that become visible only once a team is actually operating inside a market, not before.
3. Centralised Strategy, Local Execution: The Only Model That Scales
Here is where the two problems above point to the same fix. Our research asked organisations how they actually manage commerce across regions. The clearest pattern, at 36%, was a hybrid approach: central control paired with local flexibility. Another 32% run a mostly centralised model with some local adaptation.
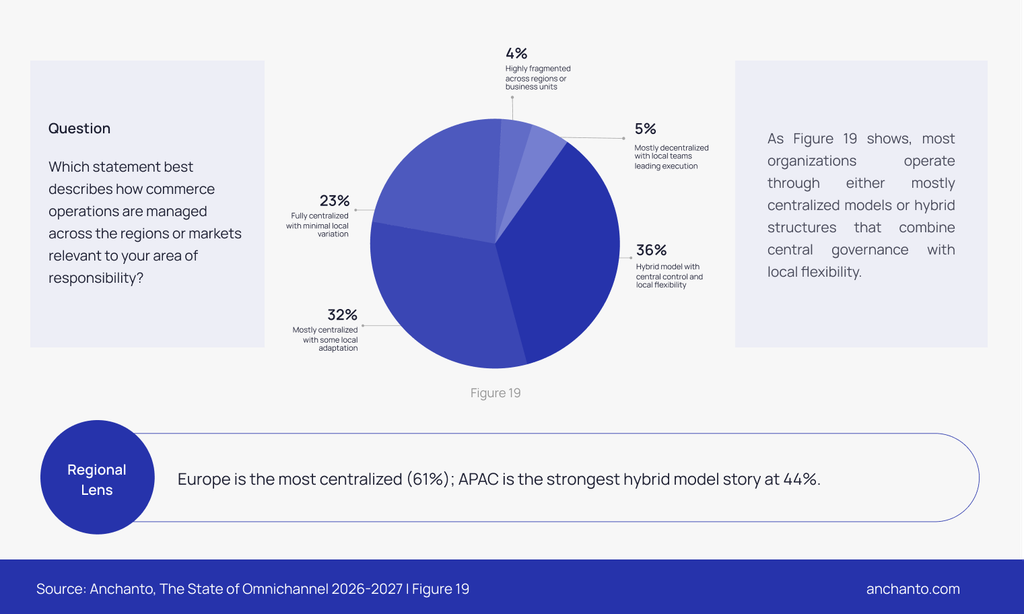
Figure 19: How commerce operations are managed across regions. A hybrid model with central control and local flexibility is the most common way commerce operations are managed across regions (36%), followed by mostly centralised with some local adaptation (32%), fully centralised (23%), mostly decentralised (5%) and highly fragmented (4%). Europe is the most centralised region (61%) and APAC the strongest hybrid story (44%). Source: Anchanto and Demand Metric, The State of Omnichannel Commerce 2026/27, survey of 408 commerce decision-makers.
In principle, a hybrid model gives ownership a clearer home: decisions move between central strategy and local teams instead of stalling across several functions. It also gives local teams room to act on regulations, marketplace rules and fulfilment issues that a central team may not see in time.
4. What This Means for Scaling Omnichannel
Closing the gap between global planning and local execution is not only a technology problem. It also depends on deciding who owns the decisions, then giving local teams enough room to make them when the market needs them to.
The patterns above are just the surface. Our report, The State of Omnichannel Commerce 2026/27, goes further into how operating models and local market friction differ across the Americas, Europe and APAC, and what connected execution looks like in practice.
Download the full report here!FAQs
1. Why do global omnichannel strategies fail in local markets?
Global omnichannel strategies fail in local markets for two reasons:
a. the strategy did not account for what the market requires, and
b. nobody clearly owns adjusting it.
Ownership is spread across IT, sales, e-commerce and operations, while local regulations, marketplace rules and fulfilment processes vary by market and are hard to plan for centrally.
2. What should an e-commerce localisation strategy cover?
The local rules that create the most friction: regulatory and compliance requirements (39%), inventory and fulfilment processes (38%), marketplace requirements (38%), platform configuration across markets (33%), carriers and delivery partners (31%) and payments (25%), according to The State of Omnichannel Commerce 2026/27.
3. How big a challenge is retail regulatory compliance across markets?
It is the most frequently named source of local market friction, cited by 39% of decision-makers, just ahead of inventory and fulfilment processes and marketplace requirements (38% each). A marketplace a brand already sells on can carry different listing, tax or fulfilment rules from one region to the next.
4. Should commerce operations be centralised or run locally?
Most organisations combine the two. A hybrid model with central control and local flexibility is the most common approach (36%), followed by mostly centralised with some local adaptation (32%). The hybrid gives ownership a clearer home while letting local teams act on regulations and marketplace rules in time.
About the data.
The State of Omnichannel Commerce 2026/27 is based on a global survey of 408 qualified commerce decision-makers (395 complete and 13 partial responses) at organisations with annual revenue above US$ 100 million, run by Anchanto with Demand Metric. Respondents are directly involved in commerce strategy, technology or operations, and are split across the Americas (27%), Europe (27%), APAC (25%) and the Middle East and Africa (21%).