
The Omnichannel Execution Gap: a Cost that Skips the Budget
Blogs
Key Highlights:
- 86% of businesses are satisfied with omnichannel performance, but only 12% describe their operations as optimised and 6% have end-to-end visibility.
- Only 14% say selling, inventory, fulfilment and delivery are “fully seamless” end to end.
- 55% report high or very high manual effort managing orders, inventory and fulfilment.
- 65% of technology respondents are very or extremely confident their stack can scale, yet 38% name integration complexity as the biggest barrier.
Most leaders in commerce believe their omnichannel business model is working well. 86% of commerce decision-makers are satisfied or better with their omnichannel performance, according to Anchanto and and Demand Metric’s report, The State of Omnichannel Commerce 2026/27. The report is based on a survey of 408 commerce decision-makers at companies with annual revenue above US$ 100 million across APAC, MEA, the Americas, and Europe. Many are already investing in AI, data, and technology to push omnichannel further.
But underneath that confidence lies a cost that rarely appears on a budget line and gets paid anyway. This cost shows up as manual hours spent reconciling what systems cannot resolve on their own, as margin lost to errors nobody caught in time, and as the moments customers notice most, a late delivery, a stockout, a promotion applied to an item that was never actually in stock. This cost is the result of the Omnichannel Execution Gap.
The Omnichannel Execution Gap is the distance between how confident organisations feel about omnichannel and how connected their operations actually are. 86% are satisfied, yet only 12% describe their operations as optimised, and only 6% have end-to-end visibility across channels and systems.
1. What is the Omnichannel Execution Gap, and What is Causing it?
The gap is not one problem. It comes from a handful of specific breakdowns between what organisations believe about their own maturity and how connected their operations actually are. The top four breakdowns that stand out are:
- Progress being considered as maturity. Most organisations describe their omnichannel operations as developing (42%) or scaling (31%), but they are still building out connected workflows. Only 12% describe their operations as optimised with unified visibility and orchestration. So, being further along than you used to be is not the same as being ready for the scale you are now operating at.
- Selling, inventory, and fulfilment rarely move as one. This is about how work flows. Only 14% of organisations report that selling, inventory, fulfilment, and delivery are “fully seamless end-to-end”. Many times, a customer’s order still has to pass through multiple handoffs, each one a place where delay, inconsistency, or manual correction is involved.
- Low visibility across the board. Even where work flows, few businesses can see all of it. Only 6% of organisations have end-to-end visibility across orders, inventory, and fulfilment. The largest group (41%) describe their visibility as good across key workflows but not fully unified. That means teams are not yet working from the same operational picture.
- Disconnected systems. Among technology respondents, 65% are very or extremely confident their current technology stack can scale. At the same time, integration complexity is the single biggest barrier they report when trying to actually scale it, named by 38% of respondents. The tools themselves are rarely the problem. How well they work together is.
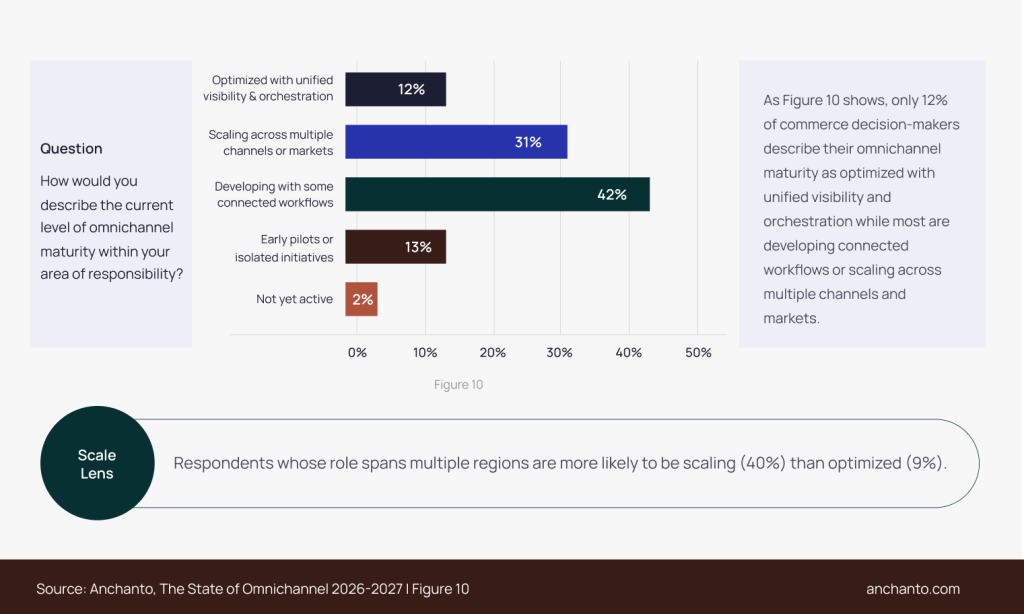
Figure 10: Current level of omnichannel maturity. Only 12% of commerce decision-makers describe their omnichannel maturity as optimised with unified visibility and orchestration. 31% are scaling across multiple channels or markets, 42% are developing with some connected workflows, 13% are at early pilots and 2% are not yet active. Source: Anchanto, The State of Omnichannel Commerce 2026/27, survey of 408 commerce decision-makers.
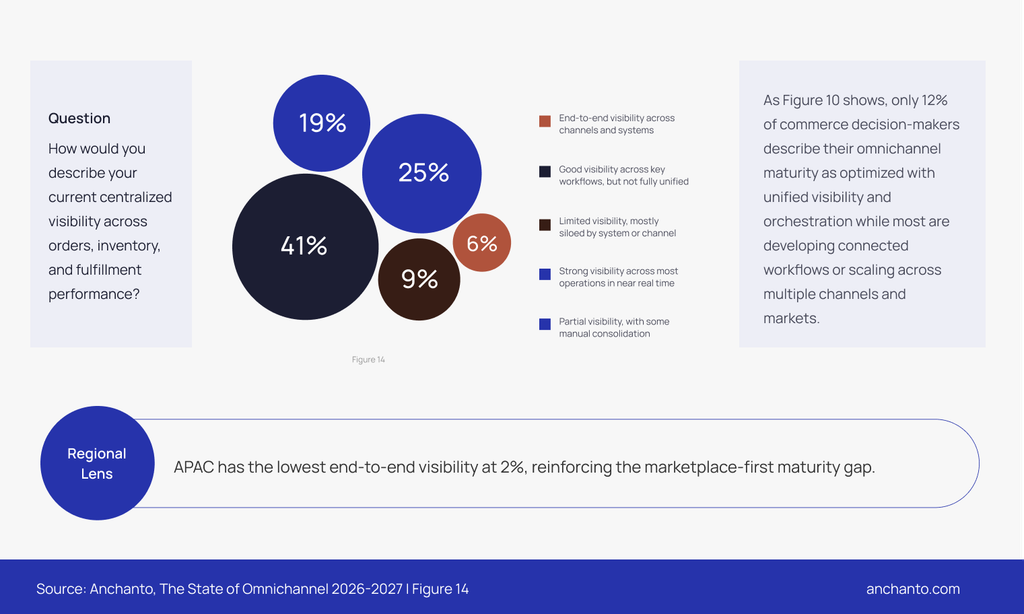
Figure 14: Centralised visibility across orders, inventory and fulfilment. Only 6% of commerce decision-makers have end-to-end visibility across channels and systems. 25% have strong visibility across most operations in near real time, 41% good visibility across key workflows but not fully unified, 19% partial visibility with some manual consolidation and 9% limited, siloed visibility. APAC is lowest on end-to-end visibility, at 2%. Source: Anchanto, The State of Omnichannel Commerce 2026/27, survey of 408 commerce decision-makers.
3. The Current Solution is Manual Work, and it has a Price
Today, most organisations are closing the Omnichannel Execution Gap by hand. More than half (55%) report high or very high manual effort just to manage orders, inventory, and fulfilment across their channels. People have become the connective tissue holding these operations together, quietly checking one system against another and patching the gaps with spreadsheets and manual reconciliation.
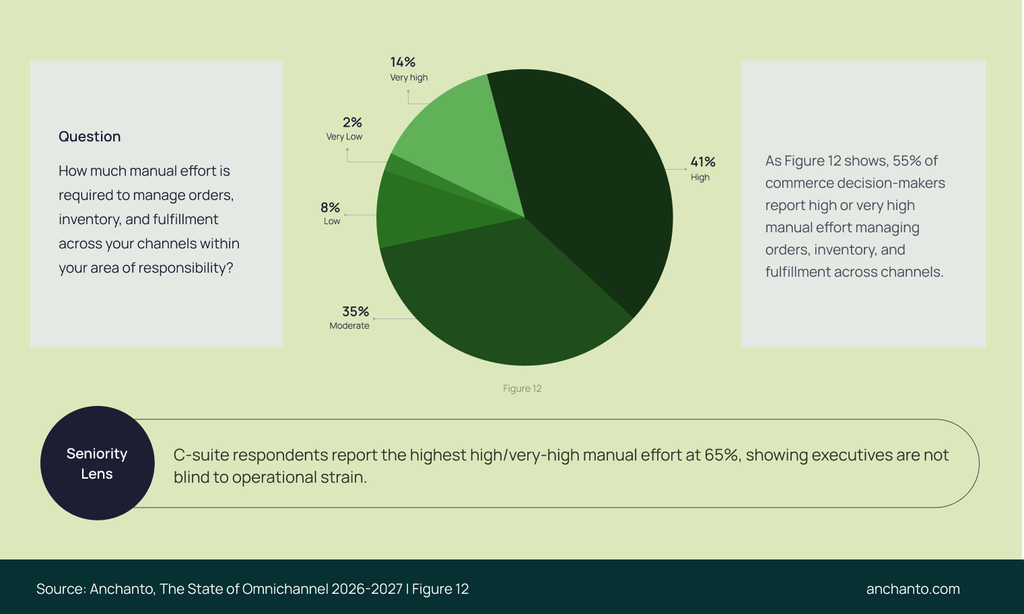
Figure 12: Manual effort required to manage orders, inventory and fulfilment. 55% of commerce decision-makers report high (41%) or very high (14%) manual effort managing orders, inventory and fulfilment across channels; 35% report moderate, 8% low and 2% very low effort. C-suite respondents report the highest share of high or very high manual effort, at 65%. Source: Anchanto, The State of Omnichannel Commerce 2026/27, survey of 408 commerce decision-makers.
That effort is not free. Manual work is what teams do to cover for disconnected systems, and that same disconnection shows up as a cost on the other end of the process too.
Additionally, in omnichannel retail, a return is rarely just a return. A return often points to a problem that started much earlier, such as inaccurate inventory, wrong product information, a fulfilment error, or a missed delivery. These are the same gaps teams are patching by hand. We asked commerce decision-makers where returns and cancellations create the most operational or business impact, and financial performance was the top answer, at 27%, ahead of inventory management and availability (19%). So, when the root cause sits further up the chain, every return becomes a margin problem, not just a customer service one.
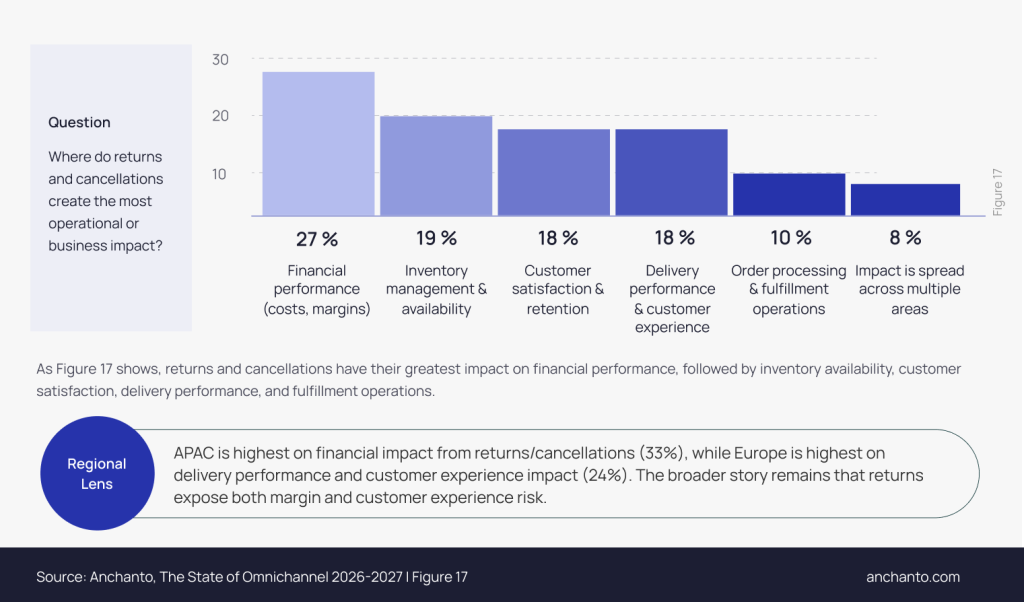
Figure 17: Where returns and cancellations create the most impact. Returns and cancellations create the most impact on financial performance, meaning costs and margins (27%), followed by inventory management and availability (19%), customer satisfaction and retention (18%), delivery performance and customer experience (18%) and order processing and fulfilment (10%); 8% say the impact is spread across areas. APAC is highest on financial impact (33%) and Europe on delivery and customer experience impact (24%). Source: Anchanto, The State of Omnichannel Commerce 2026/27, survey of 408 commerce decision-makers.
The hours spent reconciling and the revenue lost to mistakes are the hidden cost you pay for omnichannel today. It does not appear on an invoice, but it is paid all the same, in time and in margin.
4. The Real Solution is Integrated Omnichannel Operations
Manual effort can hold a gap together for a while, but it cannot close it. Closing it means coordinating your channels, systems, inventory, fulfilment and local market requirements through a single commerce operating model. When marketplace integrations, order orchestration, inventory visibility and fulfilment are connected, every team works from the same operational picture. A promotion cannot go live against stock that is not there, a warehouse order reflects real demand instead of a guess, and customers get the same accurate information whichever channel they buy from.
Organisations that get this right are best positioned to reduce the manual hours holding operations together and protect the margin that would otherwise leak away.
5. Closing the Gap Starts with Seeing it Clearly
The Omnichannel Execution Gap is not a sign that your strategy is wrong. It is a sign that the operating model underneath has not caught up with how much you have already grown. Most organisations are paying for that gap right now, whether or not it shows up anywhere on the budget.
Our report, The State of Omnichannel Commerce 2026/27, shows how the gap plays out across regions, industries and seniority levels. It also includes a 10-step Omnichannel Execution Maturity Model to help you find where your own operations are stretched and how to close the gap.
Download the full report here!FAQs
1. What is the omnichannel execution gap?
It is the distance between how confident organisations feel about omnichannel and how connected their operations are. In The State of Omnichannel Commerce 2026/27, 86% are satisfied with omnichannel performance, but only 12% describe their operations as optimised and only 6% have end-to-end visibility across channels and systems.
2. What causes the omnichannel execution gap?
Four breakdowns stand out: treating progress as maturity, selling, inventory and fulfilment not moving as one, low end-to-end visibility, and disconnected systems. Integration is the common thread: 38% of technology respondents name integration complexity as the biggest barrier to scaling their technology stack.
3. What does the execution gap cost omnichannel operations?
Mostly time and margin that never appear on a budget line. 55% of organisations report high or very high manual effort to manage orders, inventory and fulfilment, and returns and cancellations hit financial performance hardest (27%), often because of problems further up the chain, such as inventory, product information or fulfilment.
4. How do you close the omnichannel execution gap?
By connecting the systems, platforms and partners behind every channel so they work from the same real-time data. The report’s maturity model recommends prioritising marketplace integrations, order orchestration, inventory visibility and fulfilment integration, so every team works from the same operational picture.
About the data.
The State of Omnichannel Commerce 2026/27 is based on a global survey of 408 qualified commerce decision-makers (395 complete and 13 partial responses) at organisations with annual revenue above US$ 100 million, run by Anchanto with Demand Metric. Respondents are directly involved in commerce strategy, technology or operations, and are split across the Americas (27%), Europe (27%), APAC (25%) and the Middle East and Africa (21%).